Stated-project goals
The goal of this project was to evaluate the suitability of the Raspberry Pi as a generic embedded platform. To this end, I have built a low-cost portable wireless survey system, the Wireless Pi Survey, that uses the Raspberry Pi as its central component. The Raspberry Pi makes it possible to connect a wide range of devices: wireless USB adapters, GPS modules, HDMI output device, Ethernet capable device, and of host of embedded peripherals via the GPIO port. The Wireless Pi Survey system that was designed for this contest has a small LCD module that can report live network information and is very useful to track progress of the wireless survey. A number of LEDs can also be used to report status, such as the presence of an open network. A similar system could be designed around a laptop or a mobile phone, but the resulting system would be either too expensive hardware-wise, bulky (in the case of a laptop) and/or more expensive in terms of development resources. The use of the Raspian operating system, one of the operating system candidate for the Raspberry Pi, opens up access to a variety of tools that streamlines the development of new software components and the integration of the different devices. I have not encountered any difficulties bootstrapping any of the devices that I have selected for this experiment. All of them worked out out of the box with minimal configuration. I have also found that the Raspberry Pi ecosystem is quite organized and its community very active. As such, it is fairly easy to find help on various topics (installation, use of different devices and ports, development, etc.). There are also a number of module extensions, external peripheral designed specifically for the Raspberry Pi for those interested to extend its capabilities.
github project
The code for the Wi-Fi Pi survey project is hosted on github.
High-level functional specification
Requirements
- The system must run autonomously
- The system must be portable
- The system must be low-cost (in the 200$ range).
- It must be possible to get a summary of the survey while in the field; this can help troubleshooting problems and help positioning the peripherals to capture optimal amount of information
- It must be possible to generate reports from the wireless survey information collected by the system. For instance:
- List of open networks
- Proportion of open networks and networks with WEP, WPA, WPA2
- Visualisation of the network information on a geographical map
- The system must be extensible to make it possible to explore new aspects of wireless security (this requirement is the main reason why a custom piece of software was written for this project to monitor wireless traffic instead of using a tool like kismet)
The Wireless Pi Survey, shown on the following figure is a passive monitoring device that collects information about access points and their connected clients.
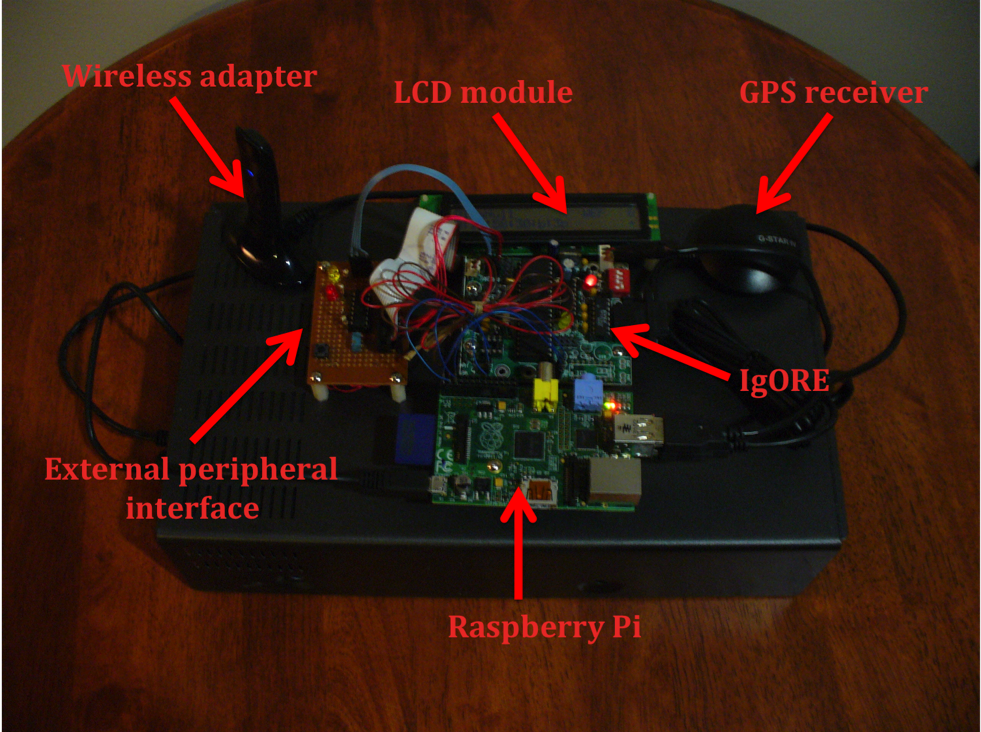
Wireless Pi Survey System Packaging
Major components
Hardware
- Raspberry Pi
- Central component of the Wireless Pi Survey system that connects a number of devices (GPS receiver, wireless adapter, LCD module) for the purpose of collecting and displaying wireless and geo-location information.
- GPS receiver (GlobalSat G-Star IV)
- Module used to determine the geographical location of the Wireless Pi Survey system
- Wireless USB adapter (Linksys WUSB600N)
- Consumer based hardware component that makes it possible to listen to the wireless information transmitted between access points and their various clients
- NewTrent USB portable charger (12000 mAh)
- Rechargeable power pack that powers the Wireless Pi Survey system
- IgORE circuit board
- 16-bit PIC18F452 microcontroller-based circuit board that can be used to interface to a host of digital and analog peripherals; the PIC18F452 firmware can be bootloaded to the microcontroller via the serial port that is present on the circuit board. The IgORE circuit board is the bridge between the Raspberry Pi and the external peripheral circuit board. Communication between the Raspberry Pi and the IgORE circuit board is done using an I2C bus. The LEDs and the push button switch are controlled by the PIC18F452 using digital input/outputs and the IgORE circuit board communicates to the LCD module using a 2-wire interface with a shift register present on the external peripheral custom circuit board.
- External peripheral interface circuit board (which contains a 2-wire LCD interface, an
array of LEDs and a push button switch)
- The external peripheral interface board, which is the consolidation point of the human-to-machine user interface of the Wireless Pi Survey system, interfaces the LCD module, the LEDs and the push button switch to the IgORE circuit board.
- Hitachi HD44780 LCD module
- This 2 by 24 character LCD is used to visualize wireless information collected by the Wireless Pi Survey system.
Software
- On the Raspberry Pi:
- wscand daemon which uses libpcap, libgps, libpcre, libsqlite3 librairies and the pthread, STL and math APIs, the i2cset, i2cget from the wiringPi project and the gpio commands; this software component is the heart of the Wireless Pi Survey system. It controls and monitors the devices connected to it to collect wireless information and outputs the information in various forms.
- gpsd daemon – Receives GPS information and makes it available to interested clients
- sqlite3 – File-based SQL database system
- exportKml tool
- PIC18F452 firmware, uploaded to the PIC18F452 microcontroller with the Jolt bootloader
- Interfaces the Raspberry Pi to the external peripheral custom circuit board
- Google Earth
- Most likely running on a remote system (on a large display!) and used to display the geographical representation of the wireless information collected by the Wireless Pi Survey system.
The following figure shows the Wireless Pi Survey hardware/software architecture and helps understand the communication paths/dependencies between the various components.
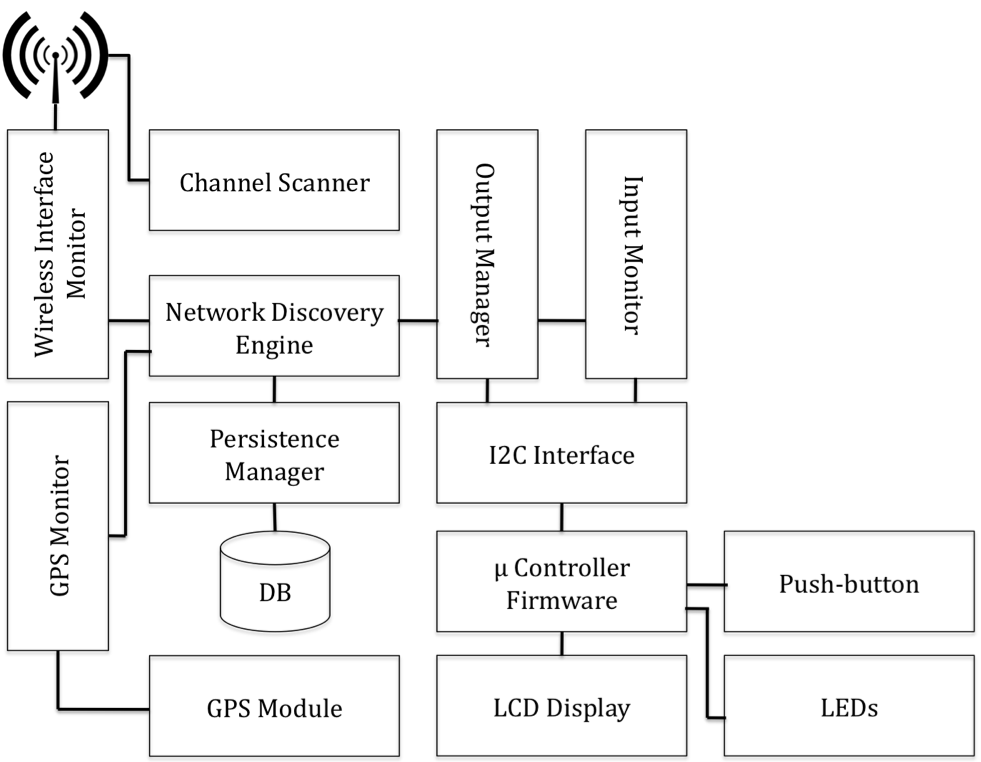
Wireless Pi Survey System Hardware/Software Architecture
Major software subsystems
Wireless interface monitor: The wireless interface monitor listens to the wireless traffic that is seen by the wireless USB adapter using the libpcap library. It parses each packet to figure out the source and destination of the traffic and identify the clients and the access points (wireless routers) that are active in its vicinity. It also tries to harvest as much information as it can from these communications, the data rate, the SSIDs assigned to the access points, if the communication is encrypted and which encryption scheme it uses, the manufacturer of the client and access points, the frequency (channel) on which traffic is transmitted, the quality of the signal (signal strength).
Channel scanner: This piece of software hops on all the channels that are supported by the wireless adapter on a fixed interval (default is 100 ms per channel). This makes it possible to detect devices on the full wireless spectrum.
Network discovery engine: The network discovery engine is responsible to identify the various entities in the wireless network and make appropriate association between these entities.
GPS monitor: The GPS monitor records the GPS coordinates of the wireless survey system over time and makes it possible to locate the wireless entities on a network map.
Output manager (menu, LED): The output manager reports the network information to the LCD module and the array of LEDs and interacts with the input monitor to display various aspects this network information.
Input monitor: The input monitor detects user input in the wireless survey system. User input is limited to detection of short button and long button action coming from the external peripheral circuit board.
Persistence manager: This subsystem records the network information on persistent storage
exportKml tool: This tool exports the network information that is stored in persistent storage in KML format. The resulting output can be used by tools like Google Earth to display network information on a map.
Microcontroller firmware: The PIC18F452 microcontroller firmware contains the Jolt bootloader, an I2C slave interrupt driven driver, a simple scheduler, a 2-wire LCD interface driver and the required application software to detect push-button events (with debouncing logic) and display information reported by the Raspberry Pi to the LCD module.
The core of the wireless survey system intelligence resides on the Raspberry Pi. The three main pieces of software that run on the Raspberry Pi and that are specific to the wireless survey application are the wscand and the gpsd daemons and the sqlite3 SQL database. The wscand and gpsd daemons are Unix processes that are automatically started when the system boots (as Linux services) and are responsible for the collection of all the information that is required for the wireless survey. The gpsd daemon keeps track of the GPS information and makes it available to the wscand daemon via the libgpsd library. The wscand daemon monitors the wireless interface and the peripherals that are connected to the Raspberry Pi. It maintains a view of the wireless network as discovered analyzing wireless packets and presents it on the LCD module that is connected to the IgORE circuit board using the I2C interface available on Raspberry Pi’s GPIO port.
Reporting status
A 2X24-character LCD display is connected to the Raspberry Pi via the IgORE circuit board and a 2-wire LCD interface module located on the external peripheral interface circuit board. This display can be used to view the wireless information collected live by the Wireless Pi Survey system. A menu system controlled by a push-button can be used to view the list of all access points and their connected clients. The following information is displayed on the LCD module for each access point:
- SSID
- BSSID
- Access point hardware manufacturer
- Signal strength
- Encryption scheme
- Date/time of first and last packet seen
- Number of packets
- GPS coordinate
- List of clients associated with the access point
The following information is available to display for each client:
- Client MAC address
- Client hardware manufacturer
- Signal strength
- Date/time of first and last packet seen
- Number of packets
There are a number of functions that can be activated with a push button on the external peripheral interface circuit board to control the wireless information to view on the LCD display. The function to execute is displayed as a single character in the lower right corner of the display. To select a function, the user shortly presses the push button. To change function, the user presses the push button for a longer period (over half a second).
There are three main navigation functions:
+: Show the next element available at the current menu level. When the system boots up, it displays the first access point detected. Selecting the “+” function will display the next access point detected. In the upper right corner of the display, when in the access point menu, the user can see the number of access points discovered since the system started. If the user goes into the access point detail menu (using the “>” as described below), the “+” can be used to view more details about the access point.
>Show more information about the current element. For instance, if the display is currently set to cycle through the list of access points, selecting the “>” will show more information about the access point that is presently listed on the display (will switch to the access point detail menu). If the user is currently cycling through the list of clients, selecting the “>” function will cause the Raspberry Pi to start giving details about the client.
<: Return to the previous menu. If the display currently shows information about a client, selecting the “<” function will tell the system to get back at displaying information about the access point to which this client is connected.
There are also functions to filter information. For instance, to display only the open networks, the “F” function can be used. The “N” function can be used to come back at seeing all access points. The “X” function can be used to reset all network information and the “G” function can be used to display the GPS menu. The GPS menu can be used to view the current coordinate and the distance travelled since the Wireless Pi Survey system was turned on. From the GPS menu, the “X” function can be used to reset the distance and the “W” function can be used to come back to the Wireless menu.
In addition to the LCD module, there are three LEDs on the Wireless Pi Survey system to report system status. The yellow LED that resides on the IgORE board is used to report the presence of open networks (access points not using any encryption). The two LEDs on the external peripheral interface board report the presence of access points using WPA (red) and WEP (yellow). These LEDs light up as soon as activity from access point with the appropriate encryption is detected. The LEDs are turned off if no activity on an access point with the appropriate encryption is seen for a period of a minute.
Design Notes
Wireless Pi Survey System
The following figures show examples of the information that is displayed on the Wireless Pi Survey system.
The first figure shows an example of the access point menu, which is the menu that is first displayed when the Raspberry Pi starts up. This menu shows the number of access points that have been detected since the system started (labeled “Network count” on the figure), and summary information of the currently selected access point (SSID, BSSID, Encryption and Signal strength). Pressing the push button switch of the external peripheral interface module while the function is set to “+” will allow the operator to see the list of all access points detected so far.
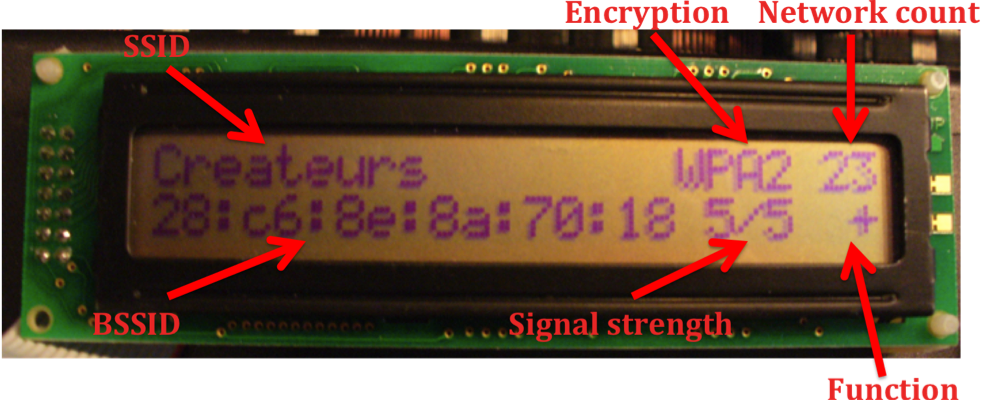
Access Point Menu
The signal strength is a measure from 1 to 5, 5 expressing a strong signal and 1 a weak signal. The function indicates the action that will take place if the user shortly presses on the push button switch on the external peripheral interface module. It is possible to change the function by pressing on the push button switch of the external peripheral interface module for a longer period.
The following figure show the signal strength section of the client detail menu. The signal strength is expressed in dBm.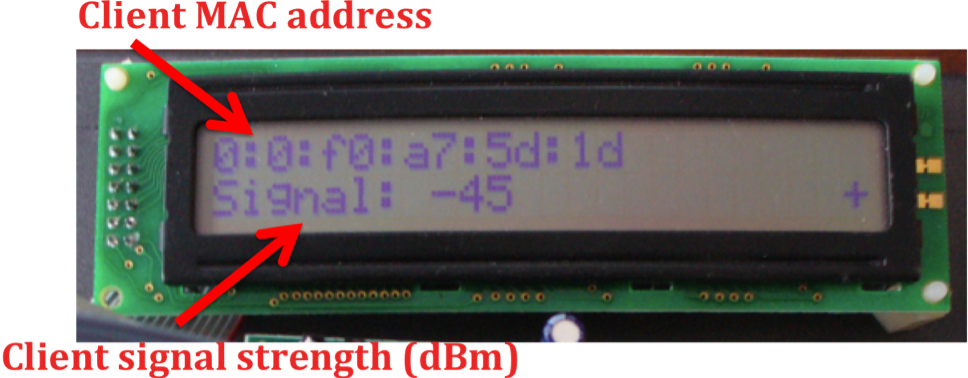
Client Detail Menu – Signal Strength
Neighbourhood survey
I have used the Wireless Pi Survey system to survey wireless networks in a neighbourhood mostly populated with single-family homes and condominium buildings. The system was installed in a car that drove at various speeds in the streets for a period of 30 minutes, with speeds ranging between 10 km/h to 40 km/h. 697 access points and 6490 clients were detected. Of the 697 access points, 29 (or 4%) were detected as open, 210 (or 30%) had WEP encryption enabled whereas 402 (or 57%) had WPA or WPA2 enabled (rest of access points are unknown). Even when driving at speeds of 40 km/h, several networks were detected by the system.
Google Earth wireless survey
Once the access point information is collected, the exportKml tool that was designed in the course of this project can be used to export the data stored in the sqlite3 database in a KML format that can be processed by geo-location-enabled tool such as Google Earth. The following figure shows the result of rendering the access point information collected in the neighbourhood survey in Google Earth.
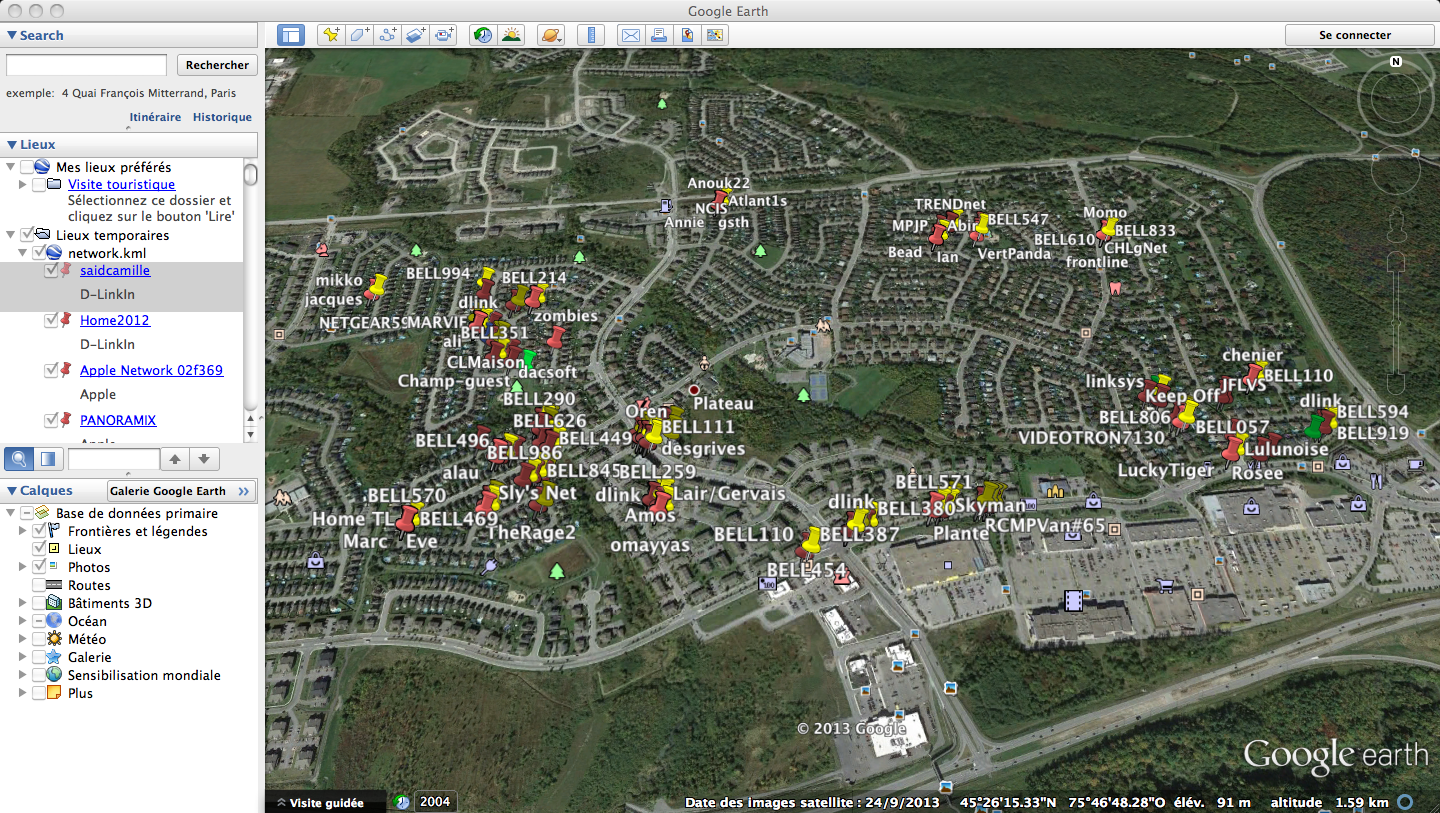
Google Earth Representation of a Wireless Survey
Power consumption
The Raspberry Pi, the IgORE circuit boards and the GPS modules are not power hungry. They can run comfortably with an output source of 1000 mA. However, when turned on, the wireless adapter tips the power requirement over 1000 mA. This was one of the challenges in this project. Fortunately, the NewTrent power supply is equipped with two output sources. I am connecting one of the output source to the Raspberry Pi and the other one to the IgORE board, Since the power buses of these two boards are connected together through the GPIO port, the power supplied to the system is sufficient. It might be a better alternative however to pass-through one of the power output directly to the wireless adapter and the second power output to both the Raspberry Pi and the IgORE board.
GPS notes
It is quite difficult to assess whether consecutive GPS readings originate from the same position, e.g. determine if the system is moving or not moving. For precision’s sake, it might be interesting to add an accelerometer to this system to detect the moving condition.
Choice of wireless adapter
For the purpose of this experiment, I have selected a wireless adapter that was spare in my home. This wireless adapter did not possess a port to connect to an external antenna. Although, I was able to collect good volume of information with it, in order to collect optimal amount of information, it would be more appropriate to use a wireless USB adapter that has an antenna, such as the Alpha AWUS036H wireless USB adapter.
Scoping development efforts
As far as development efforts are concerned, for the purpose of this project, software-wise, I have written the wscand daemon, the PIC18F452 firmware and the exportKml command. The Jolt bootloader used on the PIC18F452 to bootload the firmware on the microcontroller was written by me a number of years back. The gpsd daemon is a software component that is available on most Linux distributions. I have integrated this daemon on the Wireless Pi Survey system and made use of library staples like libpcap, libgps, libsqlite3 and libpcre and the pthread, STL and math standard C/C++ APIs to streamline development. The wscand software is a mixture of C++ and C. To interface the Raspberry Pi hardware with the IgORE board, I have used the WiringPi I2C commands. Hardware-wise, I have reused an IgORE board which I helped design (and assembled) in 2002 as a member of the Ottawa Robotics Enthusiasts club. I have designed and assembled the external peripheral interface circuit board for the purpose of this project.
The project ran from early December 2013 to March 2014 and I estimate the efforts spent around 200 hours.
Development Tools
One interesting aspect of developing the Wireless Pi Survey system is that most of the development was done on the target system. An ssh server was installed on the Raspberry Pi and the development was done directly there using remote shells from either a MacBook Pro or a Windows system running PuTTY. Building, deploying and testing the system was quick. Modifications could be done and tested relatively easily. The gcc and g++ compilers were used to build the executables.
Firmware development was done on a Windows system using MPLAB IDE and the CCS PCH C compiler. A PIC programmer was used to burn the Jolt bootloader firmware in the PIC18F452 microcontroller and afterward, the Jolt Java application was used on a Windows system to transfer the firmware on the PIC18F452 microcontroller.
Conclusions
I wanted to explore if the Raspberry Pi would be a right fit as an embedded platform. To this end, I decided to build a passive wireless survey system using off the shelf input modules and some custom hardware to supplement the Raspberry Pi. The experiment was quite successful. A daemon was written to monitor wireless traffic and GPS information and identify active access points and their connected clients. This information is collected and eventually stored in a SQL database that can be queried to report information in various form. The Raspberry Pi is quite a capable device, runs a modern operating system that gives access to a wide range of development tools and software libraries. The GPIO port makes it possible to extend the Raspberry Pi connecting custom hardware to it. With all these capabilities, it is possible to build compact and cost-effective embedded systems that address a wide range of applications.
The Wireless Pi Survey system would be an excellent starting point for wireless vulnerability analysis. The software could be refined to detect weaknesses in the various networks, identify more precisely the brand of the router and the firmware version. A tool similar to nmap, but tailored for wireless, could be designed.
References
The following links contain information that was useful for the course of this project:- Quick start guide | Raspberry Pi
- The C++ Annotations
- Programming with pcap
- Confguring the Raspberry Pi as an SSH Server
- Getting GPS to work in a Raspberry Pi | Peter Mount's Blog
- Managing Linux daemons with init scripts | Linux.com
- SQLite C/C++ Tutorial
- filelock/create_pid_file.c (from "The Linux Programming Interface")
- Stephane Gauthier's Robotic Projects
- Jolt PIC18F Bootloader Page
- GPSd - A GPS service daemon
- I2C Library - Gordons Projects
- The original IgORE
- CCS, Inc. - CCS C Compilers
Number of hits:
928
Warning: fopen(countlog.txt): Failed to open stream: Permission denied in /sdf/www/gm/m/mdubuc/WifiPiSurvey/index.php on line 198
Fatal error: Uncaught TypeError: fwrite(): Argument #1 ($stream) must be of type resource, bool given in /sdf/www/gm/m/mdubuc/WifiPiSurvey/index.php:199
Stack trace:
#0 /sdf/www/gm/m/mdubuc/WifiPiSurvey/index.php(199): fwrite()
#1 /sdf/www/gm/m/mdubuc/WifiPiSurvey/index.php(664): writeNumberOfHits()
#2 {main}
thrown in /sdf/www/gm/m/mdubuc/WifiPiSurvey/index.php on line 199